Question 10.10.2: The block diagram of a proportional control system was given......
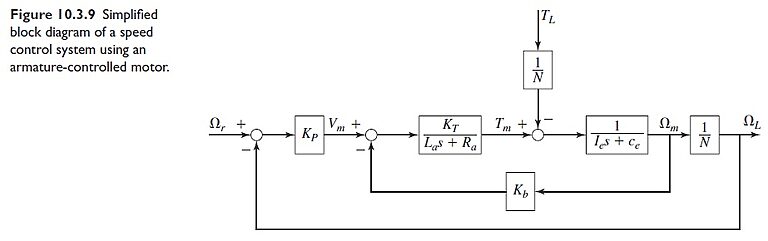
The block diagram of a proportional control system was given in Figure 10.3.9 and is shown here in modified form as Figure 10.10.3. Create a Simulink model to investigate the effects of current saturation, using the parameter values given in Example 10.8.6 and a step-command input of magnitude 104.7 rad/s (which corresponds to 1000 rpm). Assume that the current is limited to ±20 A.

Learn more on how do we answer questions.
To investigate the effects of current saturation we need to place a Saturation block between the circuit transfer function 1/(L_as + R_a) and the mechanical subsystem that includes the torque constant K_T . The limits on the Saturation block were set to −20 and 20. The result is the Simulink model shown in Figure 10.10.4. Because we are not interested in the load torque T_L here, we have omitted it from the diagram for simplicity. Gains of 2π/60 and 60/2π are used to convert from rpm to rad/s for the input, and from rad/s to rpm for the output. Set the Save Format to Array in the Block Parameters window of the To Workspace block. The data fed to the To Workspace block are used in MATLAB to create the plots shown in Figure 10.8.11.
We will use variables for the parameters in the simulation. In the Electrical block, set the numerator to 1 and the denominator to \boxed{[La Ra]}. In the Mechanical block, set the numerator to \boxed{[KT]} and the denominator to \boxed{[Ie ce]}. Set the gain to \boxed{KP} in the Controller block. In the block labeled \boxed{Kb}, set the gain to \boxed{Kb}, and in the block labeled \boxed{1/N} set the gain to \boxed{1/N}. Before running the simulation, type the following in the Command window to set the values of the parameters.


Learn more on how do we answer questions.
Script File
KT = 0.04; Kb = KT; Ra = 0.6; La = 2e-3;
Ie = 1.802e-3; ce = 4.444e-4;
N = 1.5; KP = 0.63;
The To Workspace block puts the time variable \boxed{tout} and the array \boxed{simout} in the MATLAB workspace. The first column of \boxed{simout} contains the current, and the second column contains the speed in rpm. To plot the current response, in the Command window type \boxed{plot(tout,simout(:,1))}. Type \boxed{plot(tout,simout(:,2))} to obtain a plot of the speed. The plots are shown in Figure 10.8.11.