Question 20.5: CHECKING WHETHER DIAMETERS OF MANUFACTURED RODS MEET SPECIFI......
CHECKING WHETHER DIAMETERS OF MANUFACTURED RODS MEET SPECIFICATIONS
A manufacturing process produces rods for a mechanical device. Engineers have determined that the diameters of the rods must be between 20.80 and 20.95 millimeters; rods with diameters outside these limits are unusable. As part of the standard control charting the company performs, the data in the file Rods.xlsx have been collected. Here diameters of six randomly selected rods were measured every half hour for several production shifts. How capable is this process of meeting engineering specifications?
Objective To use control charts to check whether the manufacturing process is in control, and if it is, to use standard statistical procedures to estimate the proportion of rods that meet specs.
Learn more on how do we answer questions.
The Data sheet in the file is set up exactly as in previous control chart examples. That is, there is a separate column for each observation in the subsamples of size 6. Therefore, we can—and should—examine \bar{X} and R charts as a first step to see whether the current process is in control. If it isn’t in control, then it lacks the predictability necessary to judge whether it is capable of meeting specifications. Fortunately, control charts show that the current process is in control. We show the \bar{X} chart in Figure 20.27. Note that its centerline is 20.897 mm, and its lower and upper control limits are 20.862 mm and 20.932 mm. These values indicate how the process is operating. They might or might not bear any relationship to how we would like it to be operating.
Now that we know the process is in control, hence predictable, we estimate the proportion of rods that fall within the specification limits LSL = 20.80 and USL = 20.95. One obvious way to do this is to count the number of observed rods with diameters within the limits. There are 45(6) = 270 rods in the 45 subsamples, and a simple tally shows that none of the 270 diameters are less than the LSL, whereas four are greater than the USL. Therefore, the proportion within the limits is 266/270 = 0.985.
However, this calculation uses only observed rods. What about other rods the process has been producing and will produce? To answer this question, we use a probability model. We assume the distribution of rod diameters is some standard distribution, typically the normal distribution, and then we perform a probability calculation based on the estimated parameters of this distribution. We will illustrate this procedure in a couple of steps.
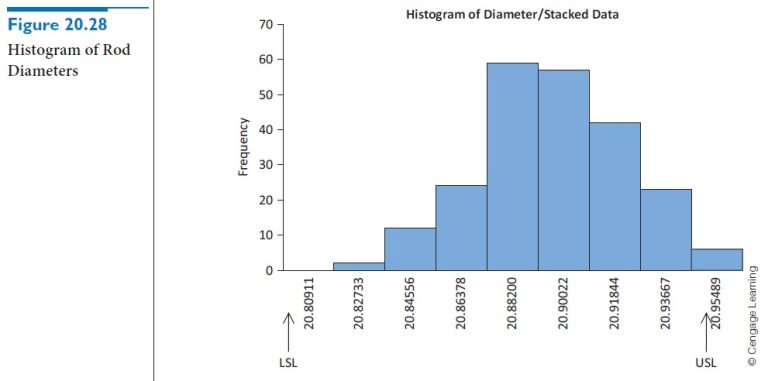
First, is it reasonable to assume that rod diameters are normally distributed? We check this by creating a histogram of rod lengths. (To use StatTools to do this, we first need to obtain one long variable of 270 diameters. This can be done either manually by copying and pasting or with the StatTools Stack procedure.) The resulting histogram in Figure 20.28 indicates a reasonably bell-shaped distribution of diameters, so that a normal probability model is reasonable. The histogram also indicates that none of the diameters are near the LSL, and that only a few are above the USL.
Next, we use the normal probability model to calculate the probabilities of falling outside the specification limits. We assume a typical rod has a diameter that is normally distributed with mean and standard deviation equal to the observed mean and standard deviation from the sample. We then use the NORMDIST function to calculate the probability below the LSL and above the USL. (See Figure 20.29.) The formulas in cells E9 and E11 are
=NORMDIST(E7,E3,E4,1)
and
=1-NORMDIST(E8,E3,E4,1)
We see that there is almost no probability of being below the LSL, but the probability of being above the USL is just below 0.02. Therefore, slightly more than 98% of rods should meet specifications if the process continues to operate as it is currently operating.
Although the probabilities of not meeting specifications are quite small, it is common to project the results to a large number of items. Specifically, the capability of a process is often quoted in parts per million (ppm). We have done this in cells E10 and E12 by multiplying each of the probabilities by 1,000,000. Surprisingly, the extremely small probability in cell E9 still implies that about 83 ppm will fall below the LSL, and the probability in cell E11 implies that almost 20,000 ppm will fall above the USL. Perhaps this process isn’t as capable as we initially thought. Two other capability indices, denoted C_p and C_{pk}, are also listed in Figure 20.29. We will discuss them in the next subsection.