Make a Bode plot for the filler in Figure 18-5 for three decades of frequency. Use semilog graph paper.
Share
Share
Question 18.3: Make a Bode plot for the filler in Figure 18-5 for three dec...

The Blue Check Mark means that this solution has been answered and checked by an expert. This guarantees that the final answer is accurate.
Learn more on how we answer questions.
Learn more on how we answer questions.
The critical frequency for this low-pass filter is
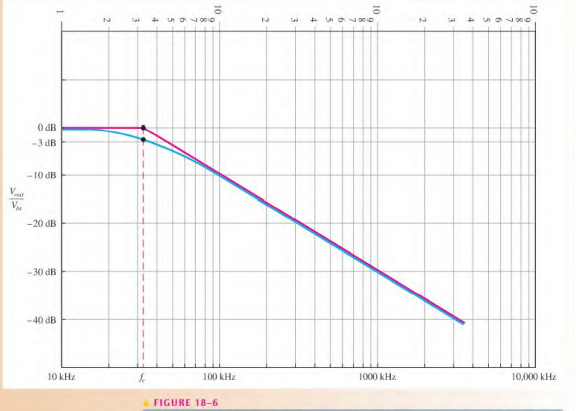
f_{c}= \frac{1}{2\pi RC}= \frac{1}{2\pi (1.0 \ k\Omega )(0.0047 \ \mu F)}= 33.9 \ kHzThe idealized Bode plot is shown with the red line on the semilog graph in Figure 18-6. The approximate actual response curve is shown with the blue line.Notice first that the horizontal scale is logarithmic and the vertical scale is linear. The frequency is on the logarithmic scale, and the filter output in decibels is on the linear scale.
The output is flat belowf_{c} (33.9 kHz). As the frequency is increased above f_{c}, the output drops at a -20 dB/decade rate. Thus, for the ideal curve, every time the frequency is increased by ten, the output is reduced by 20 dB. A slight variation from this occurs in actual practice. The output is actually at —3 dB rather than 0 dB at the critical frequency.
Bode plot for Figure 18-5. The red line represents the ideal response curve and the blue line represents the actual response.
Related Answered Questions
The critical frequency for this low-pass filter is...
The critical frequency for this high-pass filter i...
(a) Determine the value of C as follows:
X_...
The center frequency of the filter is its resonant...
Recall from Chapter 17 (Eq. 17-13 : Z= \sqr...
Since X_{L} = X_{C} ...
The center frequency is
f_{0}= \frac{\sqrt{...
f_{c}= \frac{1}{2\pi RC}= \frac{1}{2\pi (10...