Acetone is to be recovered from an aqueous waste stream by continuous distillation. The feed will contain 10 per cent w/w acetone. Acetone of at least 98 per cent purity is wanted, and the aqueous effluent must not contain more than 50 ppm acetone. The feed will be at 20^{\circ} C. Estimate the number of ideal stages required.
Question 11.2: Acetone is to be recovered from an aqueous waste stream by c...
The Blue Check Mark means that this solution has been answered and checked by an expert. This guarantees that the final answer is accurate.
Learn more on how we answer questions.
Learn more on how we answer questions.
There is no point in operating this column at other than atmospheric pressure. The equilibrium data available for the acetone-water system were discussed in Chapter 8, Section 8.4.
The data of Kojima et al. will be used.
| Mol fraction x,liquid | 0.00 | 0.05 | 0.10 | 0.15 | 0.20 | 0.25 | 0.30 |
| Acetone y, vapour | 0.00 | 0.6381 | 0.7301 | 0.7716 | 0.7916 | 0.8034 | 0.8124 |
| bubble point ŽC | 100 | 74.80 | 68.53 | 65.26 | 63.59 | 62.60 | 61.87 |
| x | 0.35 | 0.40 | 0.45 | 0.50 | 0.55 | 0.60 | 0.65 |
| y | 0.8201 | 0.8269 | 0.8376 | 0.8387 | 0.8455 | 0.8532 | 0.8615 |
| { }^{\circ} C | 61.26 | 60.75 | 60.35 | 59.95 | 59.54 | 59.12 | 58.71 |
| x | 0.70 | 0.75 | 0.80 | 0.85 | 0.90 | 0.95 |
| y | 0.8712 | 0.8817 | 0.895 | 0.9118 | 0.9335 | 0.9627 |
| { }^{\circ} C | 58.29 | 57.90 | 57.49 | 57.08 | 56.68 | 56.30 |
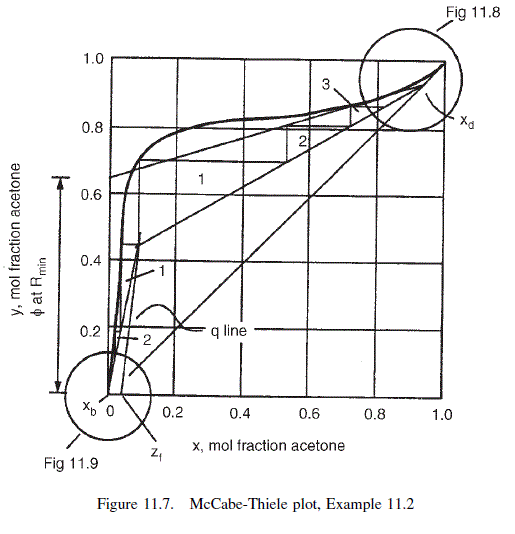
The equilibrium curve can be drawn with sufficient accuracy to determine the stages above the feed by plotting the concentrations at increments of 0.1. The diagram would normally be plotted at about twice the size of Figure 11.7.
Molecular weights, acetone 58, water 18
\text { Mol fractions acetone feed }=\frac{\frac{10}{58}}{\frac{10}{58}+\frac{90}{18}}=0.033
\text { top product }=\frac{\frac{98}{58}}{\frac{98}{58}+\frac{2}{18}}=0.94
\text { bottom product }=50 \times 10^{-6} \times \frac{18}{58}=15.5 \times 10^{-6}
Feed condition (q-line)
Bubble point of feed (interpolated) =83^{\circ} C
Latent heats, water 41,360, acetone 28,410 J/mol
\text { Mean specific heats, water } 75.3 \text {, acetone } 128 J / mol { }^{\circ} C
\text { Latent heat of feed }=28,410 \times 0.033+(1-0.033) 41,360=40,933 J / mol
\text { Specific heat of feed }=(0.033 \times 128)+(1-0.033) 75.3=77.0 J / mol { }^{\circ} C
\text { Heat to vaporise } 1 mol \text { of feed }=(83-20) 77.0+40,933=45,784 J
q=\frac{45,784}{40,933}=1.12
\text { Slope of } q \text { line }=\frac{1.12}{1.12-1}=9.32
For this problem the condition of minimum reflux occurs where the top operating line just touches the equilibrium curve at the point where the q line cuts the curve.
From the Figure 11.7,
\phi for the operating line at minimum reflux = 0.65
\text { From equation } 11.24, R_{\min }=0.94 / 0.65-1=0.45
\text { Take } R=R_{\min } \times 3
As the flows above the feed point will be small, a high reflux ratio is justified; the condenser duty will be small.
\text { At } R=3 \times 0.45=1.35, \quad \phi=\frac{0.94}{1+1.35}=0.4
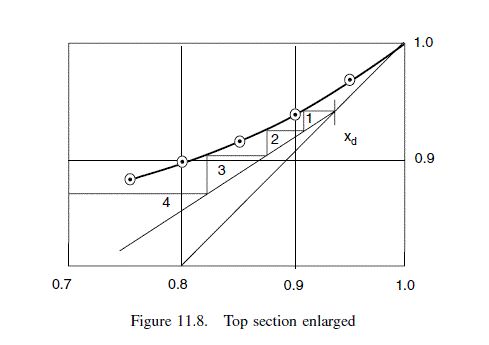
For this problem it is convenient to step the stages off starting at the intersection of the operating lines. This gives three stages above the feed up to y = 0.8. The top section is drawn to a larger scale, Figure 11.8, to determine the stages above y = 0.8: three to four stages required; total stages above the feed 7.
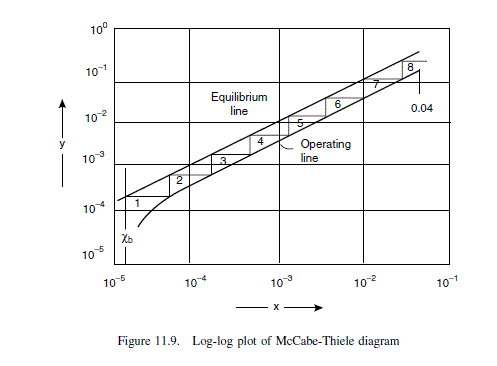
Below the feed, one stage is required down to x = 0.04. A log-log plot is used to determine the stages below this concentration. Data for log-log plot:
operating line slope, from Figure 11.7 = 0.45/0.09 D 5.0
\text { operating line equation, } y=4.63\left(x-x_{ b }\right)+x_{ b } =5.0 x-62.0 \times 10^{-6}
equilibrium line slope, from v l e data = 0.6381/0.05 = 12.8
| x = | 4 \times 10^{-2} | 10^{-3} | 10^{-4} | 4 \times 10^{-5} | 2 \times 10^{-5} | |
| Equilibrium line | y = | 0.51 | 1.3 \times 10^{-2} | 1.3 \times 10^{-3} | 5.1 \times 10^{-4} | 2.6 \times 10^{-4} |
| Operating line | y = | 0.20 | 4.9 \times 10^{-3} | 4.4 \times 10^{-4} | 1.4 \times 10^{-4} | 3.8 \times 10^{-5} |
From Figure 11.9, number of stages required for this section = 8
Total number of stages below feed = 9
Total stages = 7 + 9 = 16


Related Answered Questions
As the solubility of SO _{2} in wat...
The top and bottom temperatures (dew points and bu...
From Example 11.5, feed composition, mol fractions...
Only sufficient trial calculations will be made to...
Composition of feed + solvent, point o = 0.45 x 10...
As the liquid and vapour flow-rates and compositio...
Plate will be in the stripping section (see Figure...
From Examples 11.12 and 11.11:
\rho_...
For two phases to exist the flash temperature must...
From the McCabe-Thiele diagram in Example 11.2:
sl...