Question 22.2: Molecular nitrogen is heated in an electronic arc. The spect...
Molecular nitrogen is heated in an electronic arc. The spectroscopically determined relative populations of the excited vibrational states are listed below:
\begin{array}{lllllll}\hline n & 0 & 1 & 2 & 3 & 4 & \ldots \\\hline f_{n} / f_{0} & 1.000 & 0.200 & 0.040 & 0.008 & 0.002 & \ldots \\\hline\end{array}
You are asked to test if the spectroscopic data provided above corresponds to molecular nitrogen being in thermodynamic equilibrium with respect to vibrational energy, as well as to determine the actual temperature at which this equilibrium would be established.
Learn more on how we answer questions.
At thermal equilibrium, the population of state n is given by:
f_{n}=\frac{1 * \exp \left(-\beta\left[n+\frac{1}{2}\right] h \nu\right)}{q_{v i b}} (10)
The term “1” in the numerator of Eq. (10) is due to the fact that the vibrational energy levels are nondegenerate. For n = 0, Eq. (10) yields the population of the ground vibrational state:
f_{0}=\frac{\exp \left(-\beta \frac{h \nu}{2}\right)}{q_{v i b}} (11)
Dividing Eq. (10) by Eq. (11) yields:
\frac{f_{n}}{f_{0}}=\exp (-\beta n h \nu) (12)
According to Eq. (12), if nitrogen is in thermodynamic equilibrium with respect to vibrational energy, then a plot of \ln \left(\frac{f_{n}}{f_{0}}\right) versus n will be a straight line passing through the origin with a slope of (-\beta n h \nu).
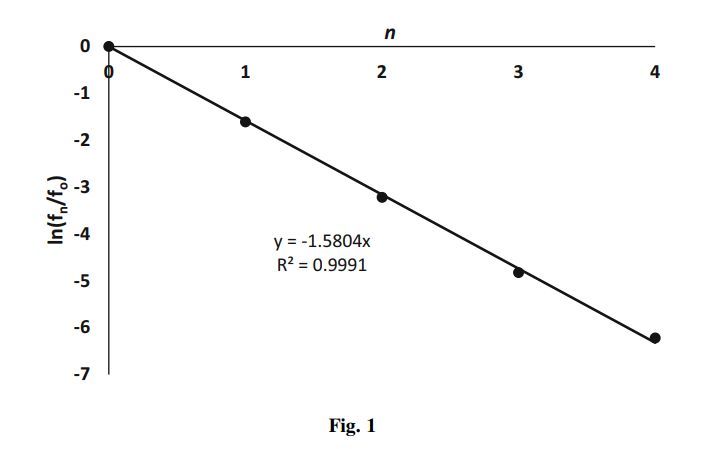
Let us examine the spectroscopic data given in the Problem Statement, and plot the values of \ln \left(\frac{f_{n}}{f_{0}}\right) versus n. The table below summarizes the results:
\begin{array}{llrrrr}n & 0 & 1 & 2 & 3 & 4 \\\hline f_{n} / f_{0} & 1.000 & 0.200 & 0.040 & 0.008 & 0.002 \\\operatorname{Ln}\left(f_{n} / f_{0}\right) & 0.000 & -1.609 & -3.218& -4.828 & -6.221 \\\hline\end{array}
The best fit to the data is a straight line passing through the origin with a slope -1.5804 (see Fig. 1). From Eq. (12), the slope is given by:
\begin{gathered}-\beta n h \nu=-\frac{h \nu}{k_{B} T}=-\frac{h c \nu}{k_{B} T}=-1.5804 \\T=\frac{h c \widetilde{v}}{1.5804 k_{B}}\end{gathered} (13)
Substituting
\begin{gathered}h=6.626 \times 10^{-34} Js , \\c=2.998 \times 10^{10} cms ^{-1} \\k_{B}=1.381 \times 10^{-23} J K ^{-1} \\\widetilde{v}=2330 cm ^{-1}\end{gathered}
in Eq. (13), we obtain:
T=2121 K