Question 11.SP.9: A subway car leaves station A; it gains speed at the rate of...
A subway car leaves station A; it gains speed at the rate of 4 ft/s² for 6 s and then at the rate of 6 ft/s² until it has reached the speed of 48 ft/s. The car maintains the same speed until it approaches station B; then the driver applies the brakes, giving the car a constant deceleration and bringing it to a stop in 6 s. The total running time from A to B is 40 s. Draw the a−t, v−t, and x−t curves, and determine the distance between stations A and B

Learn more on how we answer questions.
STRATEGY: You are given acceleration data, so first draw the graph of a versus t. You can calculate areas under the curve to determine the v–t curve and calculate areas under the v–t curve to determine the x–t curve.
MODELING and ANALYSIS: You can model the subway car as a particle without drag.
Acceleration–Time Curve. Since the acceleration is either constant or zero, the a−t curve consists of horizontal straight-line segments. Determine the values of t_{2} and a_{4} as
0 < t < 6: Change in v = area under a – t curve
v_{6} – 0 = (6 s)(4 ft/s²)= 24 ft/s
6 < t < t2: Since the velocity increases from 24 to 48 ft/s,
Change in v = area under a – t curve
48 ft/s 2 24 ft/s = (t_{2} – 6)(6 ft/s²) t_{2} = 10 s
t_2 < t < 34:
Since the velocity is constant, the acceleration is zero.
34 < t < 40: Change in v 5 area under a – t curve
0 – 48 ft/s = (6 s) a_{4} a_{4} = -8 ft/s²
The acceleration is negative, so the corresponding area is below the t axis; this area represents a decrease in velocity (Fig. 1).
Velocity−Time Curve. Since the acceleration is either constant or zero, the v−t curve consists of straight-line segments connecting the points determined previously (Fig. 2).
Change in x area under v−t curve
Adding the changes in x gives you the distance from A to B:
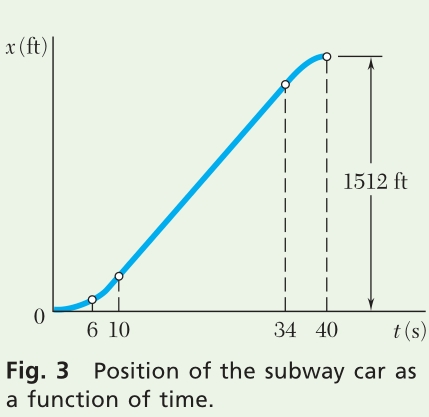
d=x_{40}-0=1512 \mathrm{ft}d =1512 ft
Position−Time Curve. The points determined previously should be joined by three parabolic arcs and one straight-line segment (Fig. 3). In constructing the x−t curve, keep in mind that for any value of t, the slope of the tangent to the x−t curve is equal to the value of v at that instant.
REFLECT and THINK: This problem also could have been solved using the uniform motion equations for each interval of time that has a different acceleration, but it would have been much more difficult and time consuming. For a real subway car, the acceleration does not instan-taneously change from one value to another.