Question 8.PE.3: To investigate the monostable multivibrator using (a) the 55...
To investigate the monostable multivibrator using (a) the 555 timer ic, (b) the
74121 monostable ic
For this exercise you will need the following components and equipment:
1 – 555 ic (timer)
1 – 74121 ic (monostable multivibrator)
1 – +5 V dc supply
1 – set of components for the 555 timer circuit:
resistors 1 × 1 kΩ, 1 × 120 kΩ, 1 × 470 kΩ, 1 × 1 MΩ
capacitors 1 × 10 nF, 2 × 0.01 μF, 1 x10 μF
1 – set of components for the 74121 circuit:
resistor 10 kΩ
variable resistor 50 kΩ
capacitor 0.01 μF
1 – square wave generator (+5 V at 1 kHz)
1 – double beam cathode ray oscilloscope
Learn more on how we answer questions.
Procedure (a)
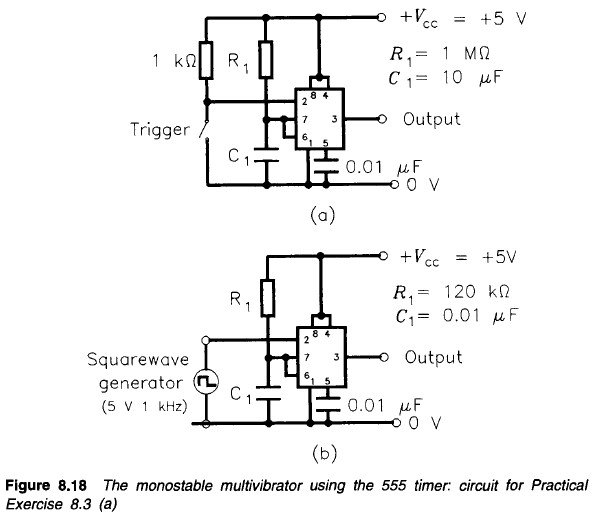
1 Connect up the circuit of Figure 8.18(a) making R_1= 1 MΩ. The pin connections for the 555 timer are shown in Figure 8.15.
Leave switch S open (this switch can be a lead which is yet to be connected).
At this point the output voltage at pin 3 should be 0 V.
2 Apply a trigger pulse by momentarily closing switch S. This will then start the
output pulse, with the output voltage rising to +5 V (= +V_CC).
After a time (T) given by T= 1.1 C_1R_1, where C_1R_1 is the time constant of the circuit, the pulse will end with the output voltage returning to 0 V.
For the values chosen, with C_1 in farads and R_1 in ohms, T should be 11 seconds.
3 Use your watch (or count in seconds), to check the time for the output pulse.
This time is also known as the pulse length.
4 Change R_1 to 470 kΩ and confirm that the new pulse length is approximately one-half of that previously found.
The oscilloscope can be used, if preferred, to check the output level changes. If you use it to inspect the charging waveform across the capacitor, be prepared for a problem! The oscilloscope may have an input impedance as low as 1 MΩ, and could slow down the charging and possibly prevent the monostable switching back to 0 V.
5 Take a look at questions 2 and 3 under ‘Conclusions’ and perform the appropriate investigation.
6 Change the circuit to that shown in Figure 8.18 (b). The signal generator should be set to give a 5 V amplitude square wave at a frequency of 1 kHz. This will now provide a series of pulses from the multivibrator for visual inspection purposes.
7 Sketch, on graph paper, the waveforms of the voltage across the capacitor C_1 and at the output, which should resemble those shown in Figure 8.19. Make sure that you show clearly the voltage and time values.
Conclusions
Copy out the following statements, selecting the correct word from within the square brackets and filling in the spaces with values or names as appropriate.
Then consider questions 1-3.
(a) Initially, with the power supply on (V_{CC} = +5 V) and no trigger pulse, the monostable multivibrator will rest in its [stable/unstable] state. The trigger input (pin 2) will be held [high/low] and the output (pin 3) will be [low/high].
(b) Connecting pin 2 to the 0 V line, by closing switch S, is equivalent to applying a [positive/negative] -going ــــــــــ pulse. When the trigger input falls to \frac {1}{3} V_{CC}, the output goes [low/high] and the monostable is set to its [stable/unstable] state.
(c) Capacitor C_{1} charges towards + V_{CC} until the voltage across it reaches the threshold value of \frac {2}{3} V_{CC}, At this point the monostable is reset to its [stable/ unstable] state and the output returns to [low/high].
1 Comparing the actual pulse lengths with their theoretical values, what is likely to be the main reason for any discrepancy?
(Hint. What type of capacitor did you use?)
2 What would be the result of a trigger pulse which lasted longer than the expected time for the output pulse?
3 Once the output has been triggered, what effect would further trigger pulses have on the pulse length?
Procedure (b): using the 74121 monostable multivibrator ic
The connection diagram for the multivibrator is shown in Figure 8.20 and the pin connections for the 74121 ic are shown in Figure 8.21.
This ic has three control inputs, A_{1}, A_{2} and B. It requires two external timing components R and C, with the pulse width (t) being given by
t = 0.7 RC
(R in ohms, C in farads, t in seconds).
The three modes of operation can now be investigated.
1 Refer to the table in Figure 8.22 and investigate each mode in turn. Use the cathode ray oscilloscope to display the input and output waveforms and measure the pulse width of the output. Draw each set of waveforms.
2 Compare theoretical and practical pulse width values.
3 Change the value of R to the 50 kΩ variable and investigate the range of pulse widths available.