Question 0.2.3: Sketching the Graph of a Rational Function Sketch a graph of...
Sketching the Graph of a Rational
Function Sketch a graph of f(x)=\frac{x-1}{x-2} and describe the behavior of the graph near x = 2.
Learn more on how we answer questions.
Your initial graph should look something like Figure 0.32a or 0.32b. From either graph, it should be clear that something unusual is happening near x = 2. Zooming in closer to x = 2 should yield a graph like that in Figure 0.32c.
In Figure 0.32c, it appears that as x increases up to 2, the function values get more and more negative, while as x decreases down to 2, the function values get more and more positive. This is also observed in the following table of function values.
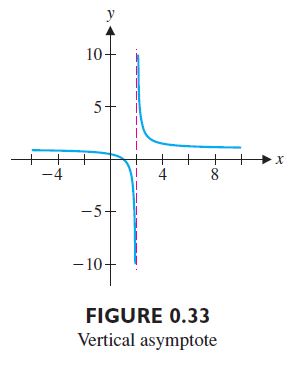
Note that at x = 2, f(x) is undefined. However, as x approaches 2 from the left, the graph veers down sharply. In this case, we say that f(x) tends to −∞. Likewise, as x approaches 2 from the right, the graph rises sharply. Here, we say that f(x) tends to ∞ and there is a vertical asymptote at x = 2. (We’ll define this more carefully in Chapter 1.) It is common to draw a vertical dashed line at x = 2 to indicate this. (See Figure 0.33.) Since f(2) is undefined, there is no point plotted at x = 2.
| x | f(x) |
| 1.8 | -4 |
| 1.9 | -9 |
| 1.99 | -99 |
| 1.999 | -999 |
| 1.9999 | -9999 |
| 2.2 | 6 |
| 2.1 | 11 |
| 2.01 | 101 |
| 2.001 | 1001 |
| 2.0001 | 10,001 |