Question 15.3: The following diagrams represent three systems at equilibriu...
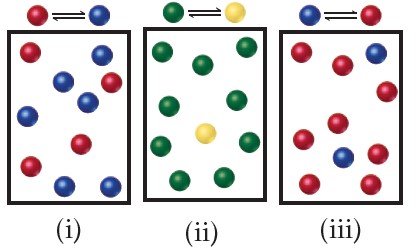
The following diagrams represent three systems at equilibrium, all in the same-size containers. (a) Without doing any calculations, rank the systems in order of increasing K_{c}. (b) If the volume of the containers is 1.0 L and each sphere represents 0.10 mol, calculate K_{c} for each system.
Learn more on how we answer questions.
Analyze We are asked to judge the relative magnitudes of three equilibrium constants and then to calculate them.
Plan (a) The more product present at equilibrium, relative to reactant, the larger the equilibrium constant. (b) The equilibrium constant is given by Equation 15.8.
K_{c} =\frac{[D]^{d} [E]^{e}}{[A]^{a} [B]^{b}} \begin{matrix} \longleftarrow products \\ \longleftarrow reactants \end{matrix} [15.8]
Solve
(a) Each box contains 10 spheres. The amount of product in each varies as follows: (i) 6, (ii) 1, (iii) 8. Therefore, the equilibrium constant varies in the order (ii) < (i) < (iii), from smallest (most reactants) to largest (most products). (b) In (i), we have 0.60 mol/L product and 0.40 mol/L reactant, giving K_{c} = 0.60/0.40 = 1.5. (You will get the same result by merely dividing the number of spheres of each kind: 6 spheres/4 spheres = 1.5.) In (ii), we have 0.10 mol/L product and 0.90 mol/L reactant, giving K_{c} = 0.10/0.90 = 0.11 (or 1 sphere/9 spheres = 0.11). In (iii), we have 0.80 mol/L product and 0.20 mol/L reactant, giving K_{c} = 0.80/0.20 = 4.0 (or 8 spheres/2 spheres = 4.0). These calculations verify the order in (a).
Comment Imagine a drawing that represents a reaction with a very small or very large value of K_{c}. For example, what would the drawing look like if K_{c} = 1× 10^{-5}? In that case, there would need to be 100,000 reactant molecules for only 1 product molecule. But then, that would be impractical to draw.