Question 11.2: Education Level of Adults The Census Bureau of the U.S. gove......
Education Level of Adults
The Census Bureau of the U.S. government found that 13 \% of adults did not finish high school, 30 \% graduated from high school only, 29 \% had some college education but did not obtain a bachelor’s degree, and 28 \% were college graduates. To see if these proportions were consistent with those people who lived in the Lincoln County area, a local researcher selected a random sample of 300 adults and found that 43 did not finish high school, 76 were high school graduates only, 96 had some college education, and 85 were college graduates. At \alpha=0.10, test the claim that the proportions are the same for the adults in Lincoln County as those stated by the Census Bureau.
Learn more on how do we answer questions.
Step 1 State the hypotheses and identify the claim.
H_{0} : The proportion of people in each category is as follows: 13 \% did not finish high school, 30\% were high school graduates only, 29 \% had some college education but did not graduate, and 28 \% had a college degree (claim).
H_{1} : The distribution is not the same as stated in the null hypothesis.
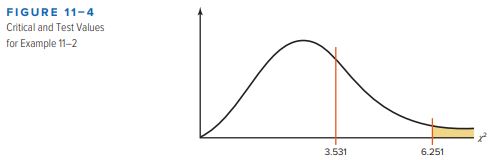
Step 2 Find the critical value. Since \alpha=0.10 and the degrees of freedom are 4-1=3, the critical value is 6.251.
Step 3 Compute the test value. First, we must calculate the expected values. Multiply the total number of people surveyed (300) by the percentages of people in each category.
\begin{aligned}& 0.13 \times 300=39 \\& 0.30 \times 300=90 \\& 0.29 \times 300=87 \\& 0.28 \times 300=84\end{aligned}
The table looks like this:
\begin{array}{|l|c|c|c|c|} \hline \text{Frequency }& \begin{gathered}\text { Did not finish } \\ \text { high school }\end{gathered} & \text{H.S. graduate} & \text{Some college} & \begin{gathered}\text { College } \\ \text { graduate }\end{gathered} \\ \hline Observed & 43 & 76 & 96 & 85 \\ Expected & 39 & 90 & 87 & 84 \\ \hline \end{array}
Next calculate the test value.
\begin{aligned}x^{2} & =\sum \frac{(O-E)^{2}}{E}=\frac{(43-39)^{2}}{39}+\frac{(76-90)^{2}}{90}+\frac{(96-87)^{2}}{87}+\frac{(85-84)^{2}}{84} \\& =0.410+2.178+0.931+0.012=3.531\end{aligned}
Step 4 Make the decision. Since 3.531<6.251, the decision is not to reject the null hypothesis. See Figure 11-4.
Step 5 Summarize the results. There is not enough evidence to reject the claim. It can be concluded that the percentages are not significantly different from those given in the null hypothesis. That is, the proportions are not significantly different from those stated by the U.S. Census Bureau.