Share
Share
Question 3.5: Plotting a DT Sinusoid with MATLAB Using MATLAB, plot the di......
Plotting a DT Sinusoid with MATLAB
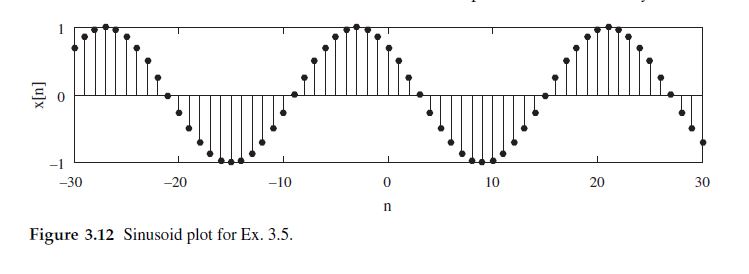
Using MATLAB, plot the discrete-time sinusoid x[n]=\cos \left(\frac{\pi}{12} n+\frac{\pi}{4}\right).
Step-by-Step
The 'Blue Check Mark' means that this solution was answered by an expert.
Learn more on how do we answer questions.
Learn more on how do we answer questions.
We represent the desired sinusoid using an anonymous function. Next, we plot this function over the desired range of n. The result, shown in Fig. 3.12, matches the plot of the same signal shown in Fig. 3.11.

The 'Blue Check Mark' means that either the MATLAB code/script/answer provided in the answer section has been tested by our team of experts; or the answer in general has be fact checked.
Learn more on how do we answer questions.
Learn more on how do we answer questions.
Script File
>> n = (-30:30); x = @(n) cos(n*pi/12+pi/4);
>> clf; stem(n,x(n),’k’); ylabel(’x[n]’); xlabel(’n’);
Related Answered Questions
Question: 3.13
Verified Answer:
The system equation in operator notation is
[latex...
Question: 3.12
Verified Answer:
Setting n = −2 in Eq. (3.19) and then substituting...
Question: 3.21
Verified Answer:
The input can be expressed as x[n]=4^{-n} u...
Question: 3.22
Verified Answer:
We solve this problem using the same approach as E...
Question: 3.19
Verified Answer:
There are several ways to find the impulse respons...
Question: 3.16
Verified Answer:
The characteristic polynomial is \left(\gam...
Question: 3.15
Verified Answer:
The characteristic polynomial is \gamma^2+6...
Question: 3.4
Verified Answer:
To begin, we use anonymous functions to represent ...