Question 40.6: Plotting the Compton Shift Graphs usually clarify complicate......
Plotting the Compton Shift
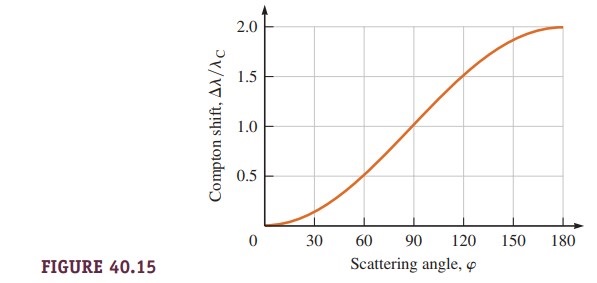
Graphs usually clarify complicated mathematical expressions. Make a graph of the relative Compton shift Δλ/λ_C versus the scattering angle φ for 0 ≤ φ ≤ 180°. In the CHECK and THINK step, comment on what is happening physically when φ > 90°.
Learn more on how do we answer questions.
INTERPRET and ANTICIPATE
From Figure 40.14, we expect the Compton shift to be smallest for small scattering angles.
SOLVE
Start with Equation 40.15
and isolate Δλ/λ_C on one side.
\frac{\Delta \lambda}{\lambda_{ C }}=(1-\cos \varphi)Substitute values from 0 to 180° for the scattering angle and plot the results (Fig. 40.15). A spreadsheet program may be helpful.
CHECK AND THINK
As expected, the Compton shift increases as the scattering angle increases. When the scattering angle is greater than 90°, the scattered photon’s motion begins to have a backward component. Consider the case when φ = 180°, so that the photon travels on a path back to its source. These photons have the greatest Compton shift, so they have the longest possible wavelength, lowest possible frequency, and least possible amount of energy after the scattering.