Share
Share
Question 30.18: Simulate the operation of the circuit shown in Fig. 30.57. C......
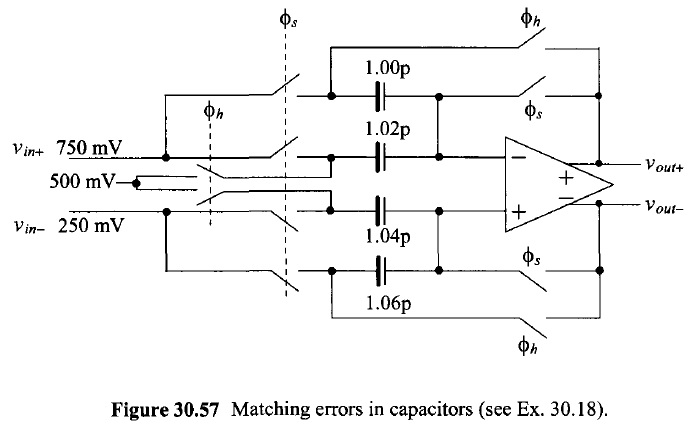
Simulate the operation of the circuit shown in Fig. 30.57. Comment on the ideal outputs and the simulation results.
Step-by-Step
The 'Blue Check Mark' means that this solution was answered by an expert.
Learn more on how do we answer questions.
Learn more on how do we answer questions.
The capacitor values were chosen arbitrarily. The input voltage, \nu_{in} , is 0.75 – 0.25 or 0.5 V. The ideal output voltage, \nu_{out} , is then 1 V. \nu_{out+} should ideally be 1 V, and \nu_{out-} should ideally be 0 V. The simulation results are shown in Fig. 30.58. The error plotted in this figure is the result of taking the difference between the ideal output and the actual output. The error for the capacitor values shown in Fig. 30.57 is approximately 5 mV. Clearly, at the risk of stating the obvious, capacitor mismatch is a fundamental limitation to ADC accuracy.

Related Answered Questions
Question: 30.2
Verified Answer:
The 0.5% mismatch (ΔR/R or 1 σ [standard deviation...
Question: 30.6
Verified Answer:
If the offset voltage before reduction is V...
Question: 30.1
Verified Answer:
For complete settling the DAC must be 10-bit accur...
Question: 30.8
Verified Answer:
Figure 30.35 shows the simulation results for the ...
Question: 30.23
Verified Answer:
The simulation results are shown in Fig. 30.70. Fi...
Question: 30.21
Verified Answer:
The simulation results are shown in Fig. 30.67. No...
Question: 30.19
Verified Answer:
This circuit shows the same mismatched capacitors ...
Question: 30.7
Verified Answer:
The simulation results are shown in Fig. 30.33. In...
Question: 30.24
Verified Answer:
The simulation results are shown in Fig. 30.72. Th...
Question: 30.22
Verified Answer:
The differential input and output signals with thi...