Question 14.10: A 10-storey RC building is shown in Figure 14.28. One of its...
A 10-storey RC building is shown in Figure 14.28. One of its inner frames is subjected to nonlinear static pushover analysis as well as nonlinear time-history analysis under the El Centro earthquake of May 1940. Determine the target displacement and ductility demands in various members.

Learn more on how we answer questions.
The major steps in the static pushover analysis are as follows:
Step 1: Choose suitable materials, appropriate loads and sizes for various members of the building.
Step 2: Choose Takeda’s hysteresis model for concrete/plastic hinges.
Step 3: Carryout analysis for gravity and lateral loads and carryout ductile design of the beams and columns in the building. Check for weak girder and strong column proportions in both vertical planes of the building.
Step 4: Choose appropriate moment-curvature properties for plastic hinges in beams and columns from the database of the software. Estimate yield moment and yield rotation for each member. In case these properties are not readily available, then derive them from the basic principles on an Excel sheet.
Step 5: Assign the plastic hinges to both ends of each member of the building.
Step 6: Carryout a displacement controlled static pushover analysis. The value of the controlling displacement is assumed to be 4% of the height of the building at the roof level.
Step 7: Generate capacity curve for the building and develop ADRS spectra. Now locate performance points using EL or DM methods.
Step 8: Examine the state of plastic hinges in the building and compute rotational ductility demand in girders and columns. Check with the acceptance criteria.
Step 9: Re-design the building, if necessary.
Steps for nonlinear dynamic analysis are as follows:
The first five steps are same as discussed earlier.
Step 6: Now carry out nonlinear time-history analysis by subjecting the building/frame to the desired accelerogram(s). Compute rotational ductility demand in girders and columns and analyses the results.
Step 7: Re-design the building, if necessary.
Data
A 2D inner frame 2–2 is chosen for the present analysis for convenience. The design and nonlinear static and dynamic analyses were carried out using ETABS.
No. of storeys =10
Ground floor height = 4.5 m; Typical storey height = 3.75 m;
Material-M30 grade concrete; Fe 415 grade steel
Beam sections, 300 × 500 mm outer beams
300 × 650 central beams
Column sections
350 × 600 – 1 to 3 storeys
350 × 500 – 4 to 6 storeys
350 × 400 − 7 to 10 storeys
Slab – 120 mm thick concrete
Live load on floor = 1.5 kN/m²
Zone = V
Mass source DL + 0.25 LL
Period of the 2D frame = 1.70 sec
Plastic Hinges with Takeda hysteresis model for concrete
Beams – M3 hinges; Columns – P-M3-M2 hinges
The girder properties are shown in Table 14.14. Similarly, column properties were determined.
Table 14.14 Girder Properties
| Floor | Girder Size, mm | \phi _{y} (rad/mm) | I (crack) mm^{4} | M_{y} (kNm) | \Theta _{y} (rad) | |
| 8–10 | 300 × 500 (outer) | Positive | 7.20E-06 | 4.31E + 08 | 66 | 5.76E-03 |
| Negative | 7.60E-06 | 5.11E + 08 | 79 | 6.08E-03 | ||
| 300 × 650 (inner) | Positive | 5.44E-06 | 1.05E + 09 | 120 | 5.08E-03 | |
| Negative | 5.44E-06 | 1.05E + 09 | 120 | 5.08E-03 | ||
| 4–7 | 300 × 500 (outer) | Positive | 7.22E-06 | 5.11E + 08 | 79 | 5.78E-03 |
| Negative | 7.32E-06 | 5.65E + 08 | 90 | 5.86E-03 | ||
| 300 × 650 (inner) | Positive | 5.72E-06 | 1.05E + 09 | 122 | 5.34E-03 | |
| Negative | 5.72E-06 | 1.05E + 09 | 122 | 5.34E-03 | ||
| 1–3 | 300 × 500 (outer) | Positive | 7.28E-06 | 5.48E + 08 | 87 | 5.82E-03 |
| Negative | 7.32E-06 | 5.62E + 08 | 90 | 5.86E-03 | ||
| 300 × 650 (inner) | Positive | 5.43E-06 | 1.28E + 09 | 152 | 5.07E-03 | |
| Negative | 5.43E-06 | 1.28E + 09 | 152 | 5.07E-03 | ||
Yield rotation is calculated using \theta _{y}= M_{y}L/EI_{crack} The member is assumed to deflect in double curvature.
Pushover case
Loads = Acceleration loads in X direction
Monitored displacement = 0.04 times the maximum z coordinate of the building that is, the building was pushed to achieve a roof displacement of 0.04 × 38.25 = 1.53 m
Total steps specified = 500
Control node = point at centre of mass at the roof of the building
For each earthquake hazard level, the structure is assigned a seismic coefficient C_{A} and C_{V}.
The elastic response spectrum for a site is constructed based on C_{A} and C_{V}.
C_{A} – Represents the effective peak acceleration of the ground. A factor of 2.5 C_{A} represents average value of peak response of a 5% damped short period system in the acceleration domain.
C_{V} – Represents 5% damped response of a 1-second system, and a factor of C_{V} /T represents acceleration response in velocity domain.
Factors C_{A} and C_{V} depend seismic zone, soil profile, distance and type of seismic source. Their values were computed using IS:1893-Part 1 and ATC-40 as C_{A}= 0.432 C_{V} = 0.576.
Results–Pushover Analysis
The pushover analysis was terminated after the 23rd step only against maximum specified steps of 500 due to the formation of a plastic mechanism. The maximum roof displacement was 1500 mm for a base shear of 312 kN. The capacity curve is shown in Figure 14.29(a). A tangent is drawn at the origin, and the first point of deviation gives the yield displacement equal to 78 mm. The floor displacements corresponding to this roof displacement are assumed to represent corresponding floor yield displacements. The ratio of the maximum floor displacement to that of the corresponding floor yield displacement gives the displacement ductility. The A–D response spectra obtained using the equivalent linearization method is shown in Figure 14.29(b). The target displacement was 309 mm. The bilinear force-deformation curve is obtained using the displacement modification method and it gives the target displacement as 445 mm. For the same capacity curve, the two methods give different target displacements. It shows that the static monotonic nonlinear pushover analysis is still evolving in modelling the nonlinear response of a MDOF system using SDOF approach.
The frame displacements, storey shears, state of the plastic hinges, rotational ductility in outer and inner girders for sagging and hogging rotations at the performance point (441 mm) are shown on Figures 14.29(c) to 14.29(h). The maximum base shear is 415 kN.
The maximum rotational ductility in outer girders in hogging and sagging is 5.3 and 4.6, respectively. The maximum rotational ductility in inner girders in hogging and sagging is 5.7 and 5.1, respectively. The maximum displacement ductility is 4.5. There was no inelasticity in any column up to the performance point.
Results–Dynamic Analysis
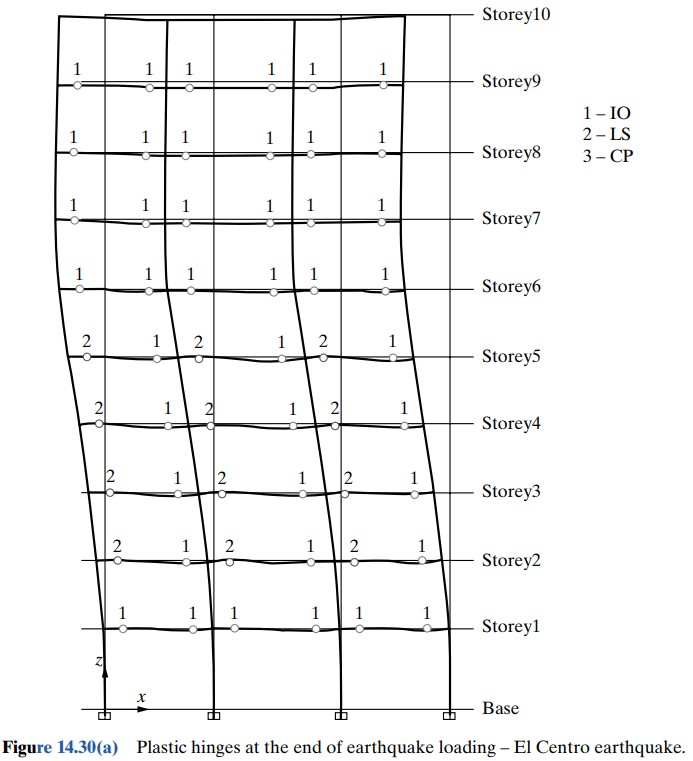
It was assumed that the N–S component of El Centro accelerogram of May 1040 is a representative accelerogram for the site under consideration in zone V. The frame was subjected to first 10 second of this earthquake. The state of plastic hinges, maximum floor displacements, top floor, time-history, storey shears, rotational ductility in outer and inner girders for sagging and hogging rotations are shown in Figures 14.30(a) to 14.30(f). It can be seen that the maximum roof displacement is 235 mm and maximum base shear is 380 kN. The maximum rotational ductility in outer girders in hogging and sagging is 3 and 2.5, respectively. The maximum rotational ductility in inner girders in hogging and sagging is 3.3 and 2.8, respectively. The maximum displacement ductility is 3.40. There was no inelasticity in any column.
The performance of the frame girders under both static and dynamic analyses are shown in Table 14.15. There are a total of six possible plastic hinges per floor or 12 hinges in any two floors. Most of the inelastic activity was in the lower six floors. The upper four floors remained in IO state that is, immediate occupancy.
Summary of Results
The frame was subjected to the nonlinear static pushover analysis as well as the N–S component of the El Centro accelerogram of May 1940, which is one of the strongest earthquakes ever recorded. The rotational ductility in the girders and the displacement ductility demand due to the El Centro earthquake are less than those demanded by the pushover analysis at the performance point. These results show that the monotonic static loading (pushover) is more severe than a nonlinear dynamic analysis under the El Centro earthquake. The results of both nonlinear static and dynamic analyses need to be interpreted with care. The dynamic analysis is more realistic but requires a very careful selection of the ground motion(s) for a given site.
Table 14.15 Performance of the Frame Girders: State of Plastic Hinges
| Floor | Pushover Analysis | Dynamic Analysis |
| 9th and 10th floors | IO-1 | IO-6 |
| 7th and 8th floors | IO-9 | IO-12 |
| 5th and 6th floors | IO-2 , LS-10 | IO-9, LS-3 |
| 3rd and 4th floors | LS-3 , CP-8 , > C-1 | IO-6 , LS-6 |
| 1st and 2nd floors | LS-9 , CP-3 | IO-9 , LS-3 |