Question 4.3: A collection of 60 laser diodes were tested, and 7 failures ...
A collection of 60 laser diodes were tested, and 7 failures occurred after 1000 h. The lifetimes obtained are tabulated below.
| Rank number (i) | Lifetime (h) | F(t_{i})=(i-0.3)/(60+0.4) |
| 1 | 181 | 0.012 (1.2%) |
| 2 | 299 | 0.028 (2.8%) |
| 3 | 389 | 0.045 (4.5%) |
| 4 | 430 | 0.061 (6.1%) |
| 5 | 535 | 0.078 (7.8%) |
| 6 | 610 | 0.094 (9.4%) |
| 7 | 805 | 0.111 (11.1%) |
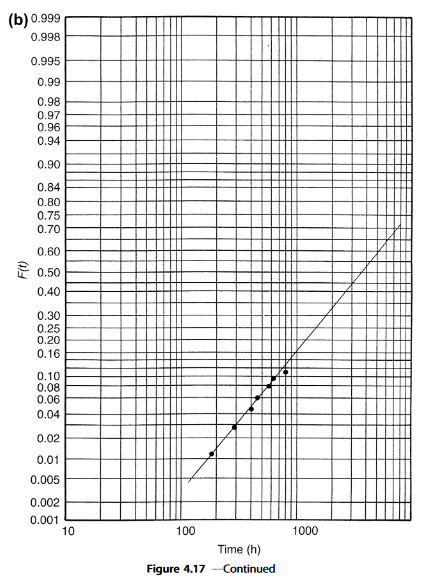
1. Plot the results in both Weibull and lognormal fashion.
2. What is the MTTF for each?
3. For the lognormal plot, what is the value of σ?
4. For the Weibull plot, what is α?
The blue check mark means that this solution has been answered and checked by an expert. This guarantees that the final answer is accurate.
Learn more on how we answer questions.
Learn more on how we answer questions.
- First, F(t_{i}) is calculated for n = 60 and i = 1, 2, 3,…, 7 and entered in the table.
The F values are plotted versus log time on Weibull and lognormal paper as shown in Figure 4.17(a) and (b). - At a value of F = 0.5, MTTF = 2170 h (Weibull) and 3600 h (lognormal).
- It was shown above that \sigma=\ln[t_{0.5}/t_{0.159}]. Substituting, \sigma =\ln[3600/980]=1.30.
- From Eqn (4.16) \ln[1-F(t)]=-(t/ \alpha)^{\beta} we note that when t = α ,\ln[1-F(t)]=-1.Thus,1-F(t)=0.368, and F(t)=0.632. At this value, which is noted on the ordinate axis, α = t = 2990 h.

Related Answered Questions
Question: 4.4
Verified Answer:
In this problem the module is the system (s), and ...
Question: 4.1
Verified Answer:
Results of the calculations are tabulated.
Tim...
Question: 4.6
Verified Answer:
First the AF is evaluated from Eqn (4.36):
...
Question: 4.2
Verified Answer:
By substitution, F(t)=1-exp[-0.0001(1000)]=...
Question: 4.5
Verified Answer:
The failure probability is given by F(t)=1-...