Question 2.7.1: Fig. 2.7-4(a) shows an N-girder which carries loads through ...
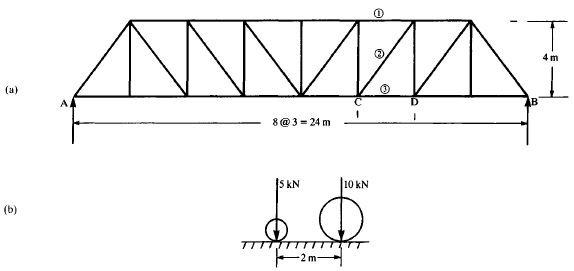
Fig. 2.7-4(a) shows an N-girder which carries loads through crossgirders at panel points on the lower boom. Sketch the influence lines for force in the representative members 1, 2 and 3. What position of the load system shown in Fig. 2.7-4(b) would cause maximum force in member 2? Either of the two loads may lead.
Learn more on how we answer questions.
An influence line shows the effect of a single rolling point load. The influence lines for force in the members must be determined first, and the forces due to the particular load system must be determined later. If the position of the single load is defined by x, the distance of the load from A, it is plain that there will only be gradual changes in the force in members as x increases in the range 0 < x < 15 (i.e. as the load moves from A to C). Similarly, changes will only be gradual whilst load is in the range 18 < x < 24. If the equations connecting the forces in the members with the positions of a single load in these two ranges can be determined, the equation in the range 15 < x < 18 is known to be linear—see Fig. 2.7-3.
0 < x < 15 (load between A and C)
Taking moments about the intersection of members 2 and 3, and considering the equilibrium of that part of the truss to the right
F_{1}4+9R_{B}=0 F_{1}=-2.25R_{B}
Resolving vertically
(4/5)F_{2}=R_{B} F_{2}=1.25R_{B}
Taking moments about the intersection of members 1 and 2
4F_{3}=R_{B}6 F_{3}=1.50R_{B}
18 < x < 24 (load between D and B)
Considering the equilibrium of that portion of the truss to the left, and taking moments about the intersection of members 2 and 3.
F_{1}4+15R_{A}=0 F_{1}=-3.75R_{A}
Resolving vertically
(4/5)F_{2}+R_{A}=0 F_{2}=-1.25R_{A}
Taking moments about the intersection of members 1 and 2
18R_{A}-4F_{3}=0 F_{3}=4.5R_{A}
Figures 2.7-4(c) and (d) show, respectively, the influence lines for R_{A} and R_{B}, while Figs 2.7-4(e), (f) and (g) show the influence lines for the forces in the members. In each case the influence line in the range 15 < x < 18 has been obtained by a straight line connection between the values at the ends of that intermediate range. It will be seen that in the cases of members 1 and 3 this addition is co-linear with other portions of the influence line. For member 2, that portion of the influence line shows a dramatic change from maximum tensile to maximum compressive force.
By inspection, it can be seen that the maximum force in member 2 will occur when the 10 kN load is 15 m from A, and the 5 kN load is 13 m from A. Its magnitude will be 0.78(10 + 5(13/15)) = 11.18 kN tensile.
Equally significant from the viewpoint of the designer is the maximum compressive force, which will be given when the 10 kN load is 18 m from A and the 5 kN load is 20 m from A. Its magnitude will be 0.31(10 + 5(4/6)) = 4.17 kN.
The diagrams are representative of the general pattern of force distribution in the members of trusses of uniform depth. Upper boom members are subjected to compressive forces and lower boom members to tensile forces, irrespective of the position of the single load, whilst diagonal members undergo a stress reversal (unless at the ends of the span) when the load passes across them.

