Question 9.4: In the article "Review of Development and Application of CRS...
In the article “Review of Development and Application of CRSTER and MPTER Models” (R. Wilson, Atmospheric Environment, 1993:41-57), several measurements of the maximum hourly concentrations (in μg/m³) of SO_2 are presented for each of four power plants. The results are as follows (two outliers have been deleted):
\begin{array}{lrrrrrr}\text{Plant 1:}& 438 & 619 & 732 & 638 & & \\\text{Plant 2:}& 857 & 1014 & 1153 & 883 & 1053 & \\\text{Plant 3:}& 925 & 786 & 1179 & 786 & & \\\text{Plant 4:}& 893 & 891 & 917 & 695 & 675 & 595\end{array}
The following output (from MINITAB) presents results for a one-way ANOVA. Can you conclude that the maximum hourly concentrations differ among the plants?
One- way ANOVA: Plant 1. Plant 2. Plant 3, Plant 4
\begin{array}{lrrrrr}\text{Source}& \text{DF}& \text{SS}& \text{MS}& F & P \\\text{Plant}& 3 & 378610 & 126203 & 6.21 & 0.006 \\\text{Error}& 15 & 304838 & 20323 & & \\\text{Tota1}& 18 & 683449 & & &\end{array}s = 142 .6 R-Sq = 55 .40% R-Sq( adj) = 46.48%
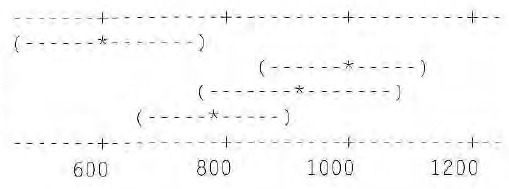
Individual 95% Cis For Mean Based on Pooled StDev
\begin{array}{cccc}\text{Leve}& \text{N}& \text{Mean}& \text{StDev}\\1 & 4 & 606.8 & 122.9 \\2 & 5 & 992.0 & 122.7 \\3 & 4 & 919.0 & 185.3 \\4 & 6 & 777.7 & 138.8\end{array}
Pooled StDev = 142. 6
Learn more on how we answer questions.
In the ANOVA table, the P-value for the null hypothesis that all treatment means are equal is 0.006. Therefore we conclude that not all the treatment means are equal.