Question 10.17: Stability Analysis Using a Bode Plot Consider the feedback c...
Stability Analysis Using a Bode Plot
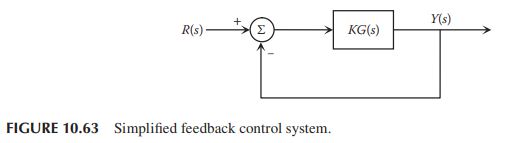
Consider the feedback control system in Figure 10.63, where
K G(s)=K \frac{100}{s(s+5)(s+20)},
and K is assumed to be 1 . Plot the Bode magnitude and phase curves using MATLAB. Give comments on the stability of the closed-loop system.
The "Step-by-Step Explanation" refers to a detailed and sequential breakdown of the solution or reasoning behind the answer. This comprehensive explanation walks through each step of the answer, offering you clarity and understanding.
Our explanations are based on the best information we have, but they may not always be right or fit every situation.
Our explanations are based on the best information we have, but they may not always be right or fit every situation.
The 'Blue Check Mark' means that either the MATLAB code/script/answer provided in the answer section has been tested by our team of experts; or the answer in general has be fact checked.
Learn more on how do we answer questions.
Learn more on how do we answer questions.
Related Answered Questions
Question: 10.24
Verified Answer:
a. The dynamics of the plant is described by
[late...
Question: 10.23
Verified Answer:
There are two ways to construct a Simulink block d...
Question: 10.22
Verified Answer:
a. The transfer function of the cart is given by
[...
Question: 10.21
Verified Answer:
For the system in Part (a), the controllability ma...
Question: 10.20
Verified Answer:
a. The system matrices \mathbf{A}, \mathbf{...
Question: 10.19
Verified Answer:
a. The characteristic equation is
|s \math...
Question: 10.18
Verified Answer:
The Bode plot for the open-loop transfer function ...
Question: 10.16
Verified Answer:
Step 1: Convert the transfer function to the frequ...
Question: 10.15
Verified Answer:
For proportional feedback control of the DC motor-...
Question: 10.14
Verified Answer:
When K=0, which corresponds to havi...