Plotting Thermodynamic Data Using Software
For the system of Example 3.2, plot the heat transfer, in kJ, and the mass of saturated vapor present, in kg, each versus pressure at state 2 ranging from 1 to 2 bar. Discuss the results.
Plotting Thermodynamic Data Using Software
For the system of Example 3.2, plot the heat transfer, in kJ, and the mass of saturated vapor present, in kg, each versus pressure at state 2 ranging from 1 to 2 bar. Discuss the results.
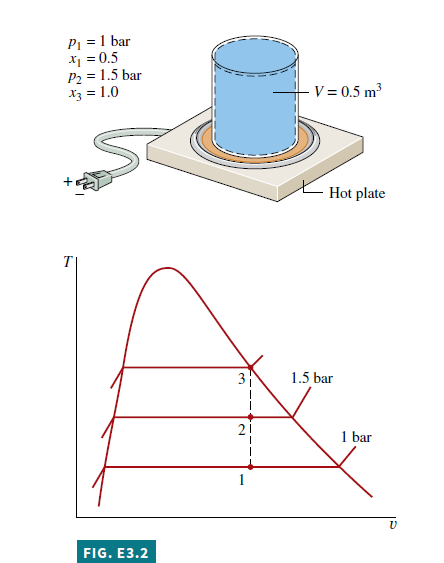
Known A two-phase liquid–vapor mixture of water in a closed, rigid container is heated on a hot plate. The initial pressure and quality are known. The pressure at the final state ranges from 1 to 2 bar.
Find Plot the heat transfer and the mass of saturated vapor present, each versus pressure at the final state. Discuss.
Schematic and Given Data: See Fig. E3.2.
Engineering Model
1. There is no work.
2. Kinetic and potential energy effects are negligible.
3. See Example 3.2 for other assumptions.
Analysis The heat transfer is obtained from the energy balance. With assumptions 1 and 2, the energy balance reduces to
\Delta U+\Delta k^{\nearrow0} E+\Delta P^{\nearrow0} E=Q-W^{\nearrow0}
or
Q=m\left(u_{2}-u_{1}\right)
Selecting Water/Steam from the Properties menu and choosing SI Units from the Units menu, the IT program for obtaining the required data and making the plots is Click the Solve button to obtain a solution for p_{2}=1.5 bar. The program returns values of v_{1}=0.8475 m ^{3} / kg and m = 0.59 kg. Also, at p_{2}=1.5 bar, the program gives m_{ g 2}=0.4311 kg. These values agree with the values determined in Example 3.2.
Now that the computer program has been verified, use the Explore button to vary pressure from 1 to 2 bar in steps of 0.1 bar. Then use the Graph button to construct the required plots. The results are
We conclude from the first of these graphs that the heat transfer to the water varies directly with the pressure. The plot of m_{ g } shows that the mass of saturated vapor present also increases as the pressure increases. Both of these results are in accord with expectations for the process.
1 Using the Browse button, the computer solution indicates that the pressure for which the quality becomes unity is 2.096 bar. Thus, for pressures ranging from 1 to 2 bar, all of the states are in the two-phase liquid–vapor region.
Skills Developed
Ability to…
• apply the closed system energy balance.
• use IT to retrieve property data for water and plot calculated data.
Quick Quiz
If heating continues at constant specific volume to a state where the pressure is 3 bar, modify the IT program to give the temperature at that state, in °C.

// Given data—State 1
p1 = 1//bar
x1 = 0.5
V = 0.5//m3
// Evaluate property data—State 1
v1 = vsat_Px(“Water/Steam”, p1,x1)
u1 = usat_Px(“Water/Steam”, p1,x1)
// Calculate the mass
m = V/v1
// Fix state 2
v2 = v1
p2 = 1.5//bar
// Evaluate property data—State 2
v2 = vsat_Px (“Water/Steam”, p2,x2)
u2 = usat_Px(“Water/Steam”, p2,x2)
// Calculate the mass of saturated vapor present
mg2 = x2 * m
// Determine the pressure for which the quality
is unity
v3 = v1
v3 = vsat_Px( “Water/Steam”,p3,1)
// Energy balance to determine the heat transfer
m * (u2 – u1) = Q – W
W = 0
Ans.
v4 = v1
p4 = 3//bar
v4 = v_PT (“Water/Steam”, p4, T4)
T4 = 282.4°C