Question 4.11: PSpice/SPICE diode model and analysis The diode circuit show...

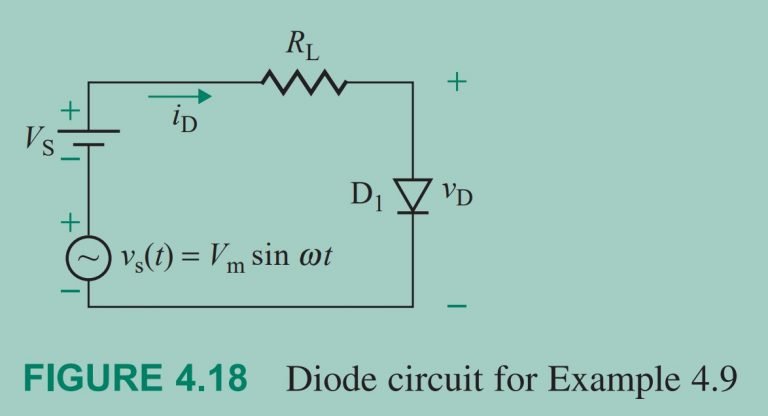
PSpice/SPICE diode model and analysis The diode circuit shown in Fig. 4.18 has V_{ S }=10 V , V_{ m }=50 mV \text { at } 1 kHz , R_{ L }=1 k \Omega, \text { and } V_{ T }=25.8 mV . Assume an emission coefficient of n = 1.84.

(a) Use PSpice/SPICE to generate the Q-point and the small-signal parameters and to plot the instantaneous output voltage v_{ O }=v_{ D } .

(b) Compare the results with those of Example 4.9. Assume model parameters of diode D1N4148:

IS=2.682N   CJO=4P   M=.3333   VJ=.5   BV=100   IBV=100U   TT=11.54N

The Blue Check Mark means that this solution has been answered and checked by an expert. This guarantees that the final answer is accurate.
Learn more on how we answer questions.

V_{ S }=10 V , V_{ m }=50 mV , \text { and } R_{ L }=1 k \Omega .


(a) From Example 4.7, the Q-point values are V_{ D }=0.7148 V \text { and } I_{ D }=9.284 mA . The diode circuit for PSpice simulation is shown in Fig. 4.23. PSpice simulation gives the following biasing point and small-signal parameters:


\begin{array}{lll}\text { ID } & 9.28 E -03 & I_{ D }=9.28 mA \\\text { VD } & 7.18 E -01 & V_{ D }=718 mV \\\text { REQ } & 5.53 E +00 & r_{ d }=5.53 \Omega \\\text { CAP } & 2.10 E -09 & C_{ j }=2.1 nF\end{array}


The PSpice plot of the transient response is shown in Fig. 4.24, which gives V_{ D }=718.35 mV and v_{ d (\text { peak })}= v_{ o (\text { peak })}=600.52 \mu V / 2=300.3 \mu V . Thus.


v_{ d }=300.3 \times 10^{-6} \sin \omega t \quad \text { and } \quad v_{ d (\text { peak })}=300.3 \mu V


(b) Example 4.9 gives V_{ D }=0.7148 V , I_{ D }=9.284 mA , r_{ d }=5.11 \Omega, v_{ d }=254.2 \times 10^{-6} \sin \omega t , and v_{ d (\text { peak })} = 254.2 \mu V , which agree closely with the PSpice results.

Screenshot 2021-10-20 140720

Related Answered Questions