Share
Share
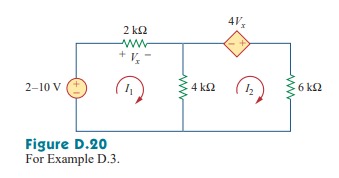
Question D.3: Plot I1 and I2 if the dc voltage source in Fig. D.20 is swe......
Plot I_{1} and I_{2} if the dc voltage source in Fig. D.20 is swept from 2 V to 10 V.
Step-by-Step
The 'Blue Check Mark' means that this solution was answered by an expert.
Learn more on how do we answer questions.
Learn more on how do we answer questions.
We draw the schematic of the circuit and set the attributes as shown in Fig. D.21. Notice how the voltage-controlled voltage source E1 is connected. After completing the schematic, we select Analysis/Setup and input the start, end, and increment values as 2, 10, and 0.5, respectively. By selecting Analysis/Simulate, we bring up the Orcad PSpice window. We select Trace/Add and click I(R1) and -I(R3) to be displayed. (The negative sign is needed to make the current through R3 positive.) Figure D.22 shows the result.


Related Answered Questions
Question: D.7
Verified Answer:
The schematic is shown in Fig. D.45. We assume tha...
Question: D.6
Verified Answer:
Recall that 20 \sin 2t = 20 \cos (2t - 9...
Question: D.1
Verified Answer:
We will follow the three steps mentioned above. We...
Question: D.2
Verified Answer:
We use Schematics to create the circuit. After sav...
Question: D.4
Verified Answer:
The circuit is the same as the one for Example 7.3...
Question: D.5
Verified Answer:
We draw the circuit and set the attributes as show...