Question 2.8: The supply function is given by P = 10 + 0.5Q. (a) State and......
The supply function is given by P = 10 + 0.5Q.
(a) State and verbally describe the slope and intercepts.
(b) Plot the supply function, P = 10 + 0.5Q, for 0 ≤ Q ≤ 100.
Learn more on how do we answer questions.
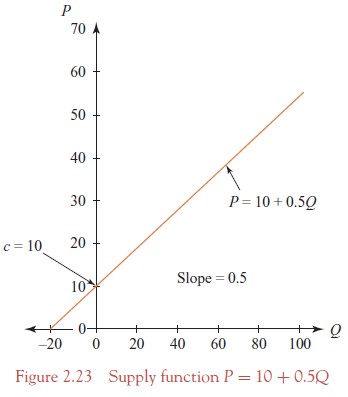
(a) The vertical intercept is c = 10. This means that the firm will supply no units at P ≤ 10. The slope ΔP/ΔQ = 0.5. This means that the price increases by 0.5 units for each successive unit increase in quantity supplied.
The horizontal intercept is calculated by substituting P = 0 into the equation of the supplyfunction, then solving for the corresponding value of Q
P = 10 + 0.5Q
0 = 10 + 0.5Q
−10 = 0.5Q
–\frac{10}{0.5} = Q → Q = −20
Therefore, the horizontal intercept is at (Q = −20, P = 0); however, Q = −20 is not economically meaningful.
(b) Method A: To plot the supply function over the range, 0 ≤ Q ≤ 100, choose various quantity values within this range. In Table 2.4 Q = 0, 20, 40, 60, 80 and 100. Substitute each value of Q into the equation of the supply function P = 10 + 0.5Q to derive corresponding values for P. Plot these points and graph the supply function as in Figure 2.23.
Method B: Plot the horizontal and vertical intercepts calculated in part (a). Draw the supply function by joining these points.
| Table 2.4 Supply schedule | |
| Quantity | Price |
| 0 | 10 |
| 20 | 20 |
| 40 | 30 |
| 60 | 40 |
| 80 | 50 |
| 100 | 60 |