Question 2.5.9: Sketch the graph of the function f if f(x)= 2x+5 if x ≤-1 ......
Sketch the graph of the function f if
f(x)= \begin{cases}2 x+5 & \text { if } x \leq-1 \\ x^2 & \text { if }|x|<1 \\ 2 & \text { if } x \geq 1\end{cases}
Learn more on how we answer questions.
We begin by making the assignment
Y_1=(\underbrace{2 x+5)(x \leq-1)}_{\text {first piece }}+\underbrace{x^2(\operatorname{abs}(x)<1)}_{\text {second piece }}+\underbrace{2(x \geq 1) .}_{\text {third piece }} \text {. }
As the variable x takes on values from Xmin to Xmax, the inequality x ≤-1 in the first piece will have a value of either 1 (if x ≤-1) or 0 (if x>-1 ). This value is multiplied by the value of 2x+5 and assigned to Y_1. In the second piece, note that both -1<x and x<1 (equivalent to |x|<1 ) must be true for the value of x² to be assigned to \mathrm{Y}_1. The general idea is that each piece is “on” only when x takes on the associated domain values.
Graphing the function in the standard connected mode allows us to see the most important features of the graph. In connected mode, the calculator includes lines between the endpoints of the pieces. Press \boxed{\text {GRAPH}}.
To eliminate these lines, we can change to dot mode and re-graph. Note that the graphing calculator makes no distinction between including and excluding an endpoint (some software
packages do).
Note: An alternative method for representing the function f is to assign each piece to a Y-value as follows:
\mathrm{Y}_1=(2 x+5)(x \leq-1), \mathrm{Y}_2=x^2(\operatorname{abs}(x)<1), \mathrm{Y}_3=2(x \geq 1)
The graphing of the three screens, however, is a rather slow process. Speed can be improved by graphing Y_4=Y_1+Y_2+Y_3 to obtain the graph of f (be sure to turn off Y_1, Y_2, \text {and} Y_3 ). To turn off Y_1 on the TI-83/4 Plus, place the cursor on the = sign to the right of Y_1 and press \boxed {\text {ENTER}}.
Yet another method for representing the function f is to assign each piece to a Y-value using division, as follows:
Y_1=(2 x+5) /(x \leq-1), \quad Y_2=x^2 /(\operatorname{abs}(x)<1), \quad Y_3=2 /(x \geq 1)
Graphing the three Y-values gives us the graph of f once more. The advantage of this method is apparent when you use the connected mode-try it!
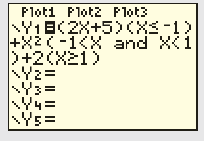
Calculator Note: Recall that |x|<1 or, equivalently, -1<x<1 can also be written as ” -1<x and x<1.” The operators “and” and “or” are found under the TEST LOGIC menu on the TI-83/4 Plus. We can use “and” to make an alternative assignment for the function in Example 9, as shown in the figure.